What Is a Landing Page Conversion? A Complete 2026 Guide With Real Benchmarks
Your ad gets clicks, but your sales numbers stay flat. That gap frustrates almost every marketer running paid traffic today. The fix starts with one question: what is a landing page conversion, and how do you measure it correctly? This guide answers that question with real 2026 data, a full benchmark table, and clear steps you can apply today.
Author & Review Note
Written and reviewed by our conversion rate optimization editorial team, drawing on published 2026 industry benchmark reports from Unbounce, WordStream, HubSpot, and First Page Sage. Updated July 2026.
What Is a Landing Page Conversion?
A landing page conversion happens when a visitor completes the one specific action a page asks for. That action might be filling out a form, buying a product, booking a demo, or signing up for a trial. Nothing else on that page competes for the visitor’s attention.
This definition matters because it separates real business results from vanity numbers. A page view means nothing on its own. Understanding what is a landing page conversion means recognizing that a stranger took a concrete step toward becoming a customer, not just a step toward reading your content.
Marketers often confuse this term with general website traffic metrics. Here is a quick way to keep the concepts separate:
- A visit counts anyone who lands on the page.
- A click counts anyone who taps a link or button.
- A landing page conversion counts only the visitors who complete the target goal.
- A bounce counts anyone who leaves without any further action at all.
Macro Conversions vs Micro-Conversions on a Landing Page
Not every action on a page carries the same weight. A full landing page conversion, often called a macro conversion, is the main goal the page exists to drive, such as a completed purchase or a submitted form.
Micro-conversions sit a step below that. These are smaller signals of interest that hint a visitor might convert soon, even though they have not completed the main goal yet.
- Scrolling past the halfway point of the page
- Playing an embedded demo or product video
- Clicking to expand a pricing or FAQ section
- Starting a form without finishing it
Tracking both levels gives you a fuller picture. A page with strong micro-conversion activity but a weak landing page conversion rate usually points to a problem right at the final step, such as a confusing form or a missing trust signal.
How a Landing Page Conversion Differs From a Regular Website Visit
Most website pages serve several purposes at once. A homepage links to products, a blog, a contact form, and a careers page all in one view. Visitors can wander anywhere they like.
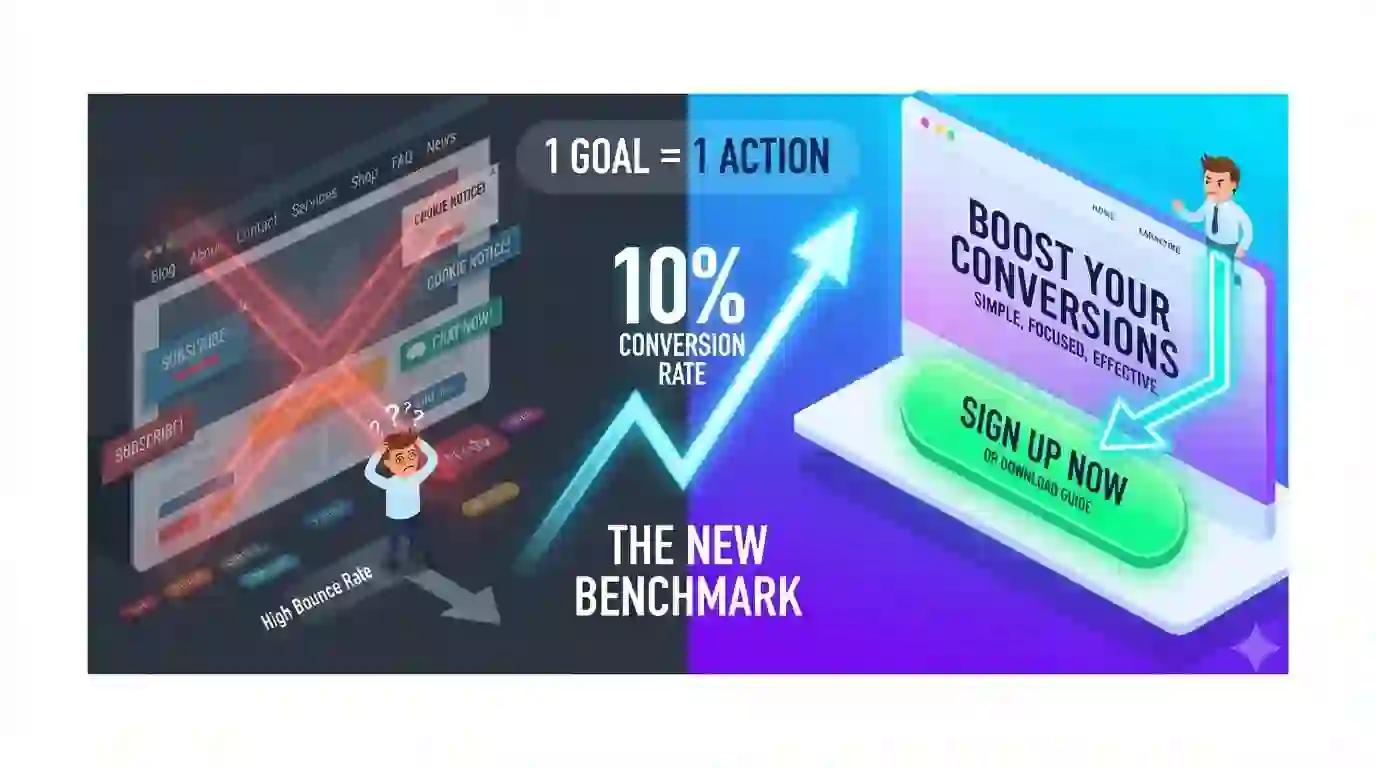
A dedicated landing page removes that freedom on purpose. Every headline, image, and button points toward a single outcome. That focus is exactly why a landing page conversion rate usually beats a regular page’s conversion rate by a wide margin.
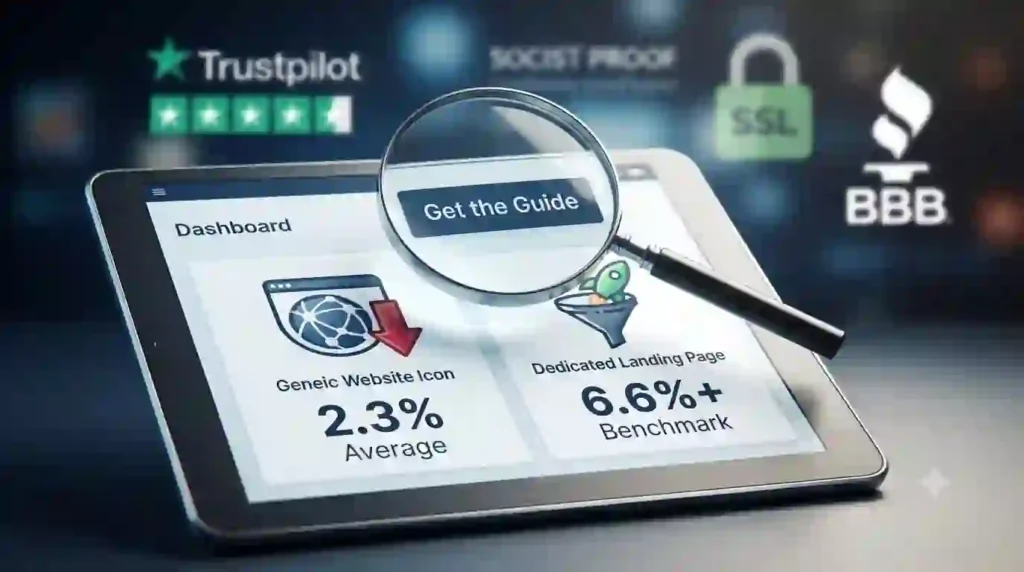
Dedicated landing pages typically convert two to three times higher than generic product or homepage traffic for the same paid campaign, according to 2026 benchmark analysis from COREPPC. The removed navigation and matched messaging drive that lift, since visitors face fewer distractions between arrival and action.
Why Landing Page Conversions Matter for Any Business
Every dollar spent on ads exists to produce a landing page conversion, not just a click. Clicks cost money whether or not they turn into anything. Conversions are the only outcome that pays that cost back.
Answering what is a landing page conversion worth to your business starts with the reasons this metric deserves constant attention:
- It directly affects your cost per lead or cost per sale.
- It tells you whether your offer matches what your traffic actually wants.
- It shows you where visitors lose interest before they act.
- It gives you a single number to test against every design or copy change.
Picture a business spending $4,000 on ads to drive 2,000 clicks to a landing page. At a 2% conversion rate, that spend produces 40 leads, for a cost of $100 per lead. Raise that same page to a 4% landing page conversion rate, and the same $4,000 now produces 80 leads at $50 each. No extra ad spend gets added anywhere in that math.
How to Determine the Conversion Rate of Your Landing Page
The formula behind a landing page conversion rate stays simple. Divide total conversions by total visitors, then multiply by 100.
- Conversions ÷ Total Visitors × 100 = Conversion Rate
For example, a page with 5,000 visitors and 250 completed sign-ups converts at 5%. Run that same formula every week, and you get a trend line instead of a single snapshot.
A Worked Example: Calculating a Real Landing Page Conversion Rate
Numbers become clearer with a full walkthrough. Say a webinar registration page receives 1,200 visitors over one week and collects 180 completed signups.
Divide 180 by 1,200, which equals 0.15. Multiply that by 100, and the landing page conversion rate for that week comes out to 15%, a strong result by almost any industry standard.
Track this number inside your analytics platform rather than counting manually. Automated tracking removes human error and lets you segment results by traffic source, device, and time period, which manual spreadsheets rarely handle well at scale.
What Counts as a Landing Page Conversion Goal?
Not every business defines a landing page conversion the same way. The right goal depends on what your page sells and what your sales process looks like.
Common conversion goals include:
- A completed contact or lead form
- A finished purchase or checkout
- A booked demo or consultation call
- A free trial or account signup
- A confirmed webinar registration
- A downloaded guide, template, or resource
Pick one primary goal per page. Pages built around a single clear goal consistently outperform pages that chase several actions at once, since visitors get confused about what to do first when a page offers three or four competing buttons.
Average Landing Page Conversion Rate Benchmarks (2026 Data)
Numbers without context mislead more than they help. A 3% rate might be excellent for one industry and a warning sign for another. The table below pulls from several 2026 benchmark reports so you can compare fairly.
| Industry / Page Type | Typical Range | Considered Strong |
|---|---|---|
| All industries (broad median) | 2.35% – 6.6% | 10%+ |
| SaaS free trial pages | 3% – 7.2% | 10%+ |
| Ecommerce product pages | 1.3% – 3.5% | 5%+ |
| Legal and financial services | 8.4% – 16% | 18%+ |
| B2B consulting and tech services | 9% – 14% | 16%+ |
| Events and webinar registration | 12% – 40% | 25%+ |
| Home services lead generation | 7% – 8.5% | 12%+ |
The industry median lands near 6.6% across roughly 41,000 landing pages studied by Unbounce, while WordStream’s broader cross-industry dataset, which counts more page types, shows a lower median of 2.35%. Both figures are correct; they simply measure different populations of pages. First Page Sage’s 2026 client dataset separately puts B2C pages at 3.9% and B2B pages at 3.6%, based on data gathered from more than eighty client accounts.
These ranges answer what is a landing page conversion worth in practice for each type of business, and they show why comparing your number to your own industry row matters more than chasing one universal target.
Use your own industry row as the real target, not the overall average. A SaaS company hitting 4% may already be outperforming its category, while a legal services page at the same 4% has real room to grow before it matches what similar firms achieve.
The Core Elements That Drive a Landing Page Conversion
Design choices either help or hurt a landing page conversion, and the difference usually comes down to a handful of repeatable factors.
- Message match: the headline repeats the exact offer from the ad or link that brought the visitor, so nobody feels misled the moment the page loads.
- A single call-to-action: one button, repeated in a few places if needed, instead of five different options competing for attention.
- Short forms: every extra field lowers completion rates, so only essential information belongs on the form.
- Real social proof: actual reviews, client logos, or case study numbers instead of vague claims.
- Fast load times: slow pages lose visitors before the message even loads on either mobile or desktop.
- A clean layout: no distracting navigation menu pulling attention away from the one goal.
Pages that follow this list consistently outperform pages that skip even two or three of these elements. Small design decisions compound into large conversion differences over time, especially at higher traffic volumes.
Common Reasons Landing Page Conversions Fail
Most underperforming pages share the same handful of problems. Spotting these early saves weeks of wasted ad spend.
- The headline does not match the ad that drove the click.
- The form asks for too much information too soon.
- The page loads slowly, especially on mobile connections.
- No trust signals appear anywhere near the call-to-action.
- Multiple competing buttons confuse the visitor about the next step.
- The offer feels vague instead of specific and valuable.
A landing page conversion rate rarely drops because of one giant mistake. It usually drops from several small frictions stacked together, each one shaving off a small share of visitors until the total loss becomes obvious in the reporting.
How to Improve Your Landing Page Conversion Rate
Raising a landing page conversion rate takes structured testing, not guesswork. Start with the changes that carry the biggest expected impact.
- Match your headline word-for-word to your ad or email subject line.
- Cut form fields down to the minimum your sales team truly needs.
- Add one specific testimonial or result near your call-to-action.
- Test button copy that states a clear benefit instead of a generic word.
- Compress images and remove unused scripts to speed up load time.
- Run one A/B test at a time so you know exactly what caused the lift.
- Rebuild your mobile layout separately instead of shrinking the desktop version.
Short-form pages under 600 words with a single above-the-fold call-to-action convert roughly 17% better for simple offers, based on 2026 testing data compiled by Digital Applied. Complex, high-consideration offers often need more supporting content instead, so match your page length to your offer’s complexity rather than copying a template built for a different type of decision.
How a Landing Page Conversion Rate Affects Return on Ad Spend
Return on ad spend, often shortened to ROAS, depends directly on how well a page turns clicks into results. A landing page conversion rate improvement flows straight through to that number without touching your media budget at all.
Consider a campaign generating $10,000 in revenue from $2,000 in ad spend, a five-to-one ROAS. If a landing page conversion rate doubles through better message match and a shorter form, revenue from that same traffic and spend can also double, pushing ROAS toward ten-to-one.
This is why performance marketing teams treat conversion rate work as seriously as media buying. A skilled buyer can only push cost per click down so far, but a well-built landing page conversion rate has far more room to improve with the right testing plan.
Landing Page Conversion Rate by Traffic Source
Not all traffic behaves the same way once it lands on your page. Where a visitor comes from shapes how likely they are to complete a landing page conversion.
- Paid search traffic converts around 10.9% on average.
- Paid social traffic converts around 12%.
- Display ad traffic converts lower, typically 4% to 5%.
- Warm email traffic often converts well above 15%, since the audience already knows your brand.
Segment your reporting by channel before you judge a page’s overall performance. A page can look mediocre in blended data while quietly excelling with one specific traffic source and dragging down the average with a weaker one.
Landing Page Conversion Rate vs Click-Through Rate
Marketers sometimes treat click-through rate and conversion rate as the same success signal. They measure two very different stages of the same journey, and mixing them up leads to bad decisions about what is actually working.
Click-through rate tells you whether your ad or email copy earns attention. It says nothing about what happens after someone arrives. A high click-through rate paired with a weak landing page conversion rate almost always points to a mismatch between the promise in the ad and the reality on the page.
- Click-through rate measures interest in your message.
- A landing page conversion rate measures the value that message actually delivers once visitors arrive.
- Improving one metric without checking the other can quietly waste ad spend for months.
Always read these two numbers together. A campaign generating strong clicks but a falling landing page conversion rate usually needs page-level fixes, not a new round of ad creative. This comparison also highlights what is a landing page conversion truly worth measuring: real value delivered, not just attention earned.
Mobile vs Desktop Landing Page Conversion Differences
Mobile traffic now makes up the majority of landing page visits for most businesses, yet it still converts lower than desktop traffic in most categories. HubSpot’s 2026 landing page report puts the average mobile conversion rate at 2.8%, compared with 4.8% on desktop.
Form complexity mostly explains what is a landing page conversion losing on a small screen versus a larger one. Long forms feel far more tedious to complete on a small screen, and a large share of mobile visitors abandon a form specifically because of that friction. Building separate, simplified mobile layouts closes much of this gap for many businesses, since shorter forms and larger buttons remove the friction that causes abandonment.
A Quick Pre-Launch Landing Page Conversion Checklist
Run through this list before any new page goes live. Checking these details early answers what is a landing page conversion actually going to depend on, before real ad spend is on the line. Catching these issues before launch costs far less than fixing them after a campaign has already spent money.
- Does the headline match the exact ad or email that drives traffic here?
- Does the page load in under three seconds on a mobile connection?
- Is there exactly one primary call-to-action button?
- Does the form ask for the fewest fields your team can work with?
- Is at least one piece of real social proof visible without scrolling far?
- Is conversion tracking installed and tested before the first visitor arrives?
Skipping this checklist is one of the most common reasons a new landing page conversion rate disappoints in its first week, since small technical issues often hide until real traffic starts arriving.
Tools That Help You Track Landing Page Conversions
You cannot improve what is a landing page conversion for your business without measuring it accurately first. A handful of tool categories cover almost every tracking need for this metric.
- Web analytics platforms for overall conversion tracking and segmentation
- Tag management systems for firing conversion events accurately
- Heatmap and session recording tools for spotting where visitors hesitate
- A/B testing platforms for running controlled experiments
- Form analytics tools for finding exactly which field causes drop-off
Set up conversion tracking before you launch any paid campaign, not after. Waiting even a few weeks means losing data you can never fully recover, and that gap makes it much harder to know whether early changes actually helped.
How Long Should You Test Before Trusting a Landing Page Conversion Rate?
A single good or bad day tells you almost nothing. Small sample sizes swing wildly, and treating early numbers as final often leads teams to abandon a page that only needed more time, or to celebrate a page that was never truly outperforming.
As a general rule, wait until a page collects at least 100 conversions before drawing firm conclusions about its true landing page conversion rate. Fewer than that, and normal random variation can make a mediocre page look great or a great page look mediocre for a few days at a time.
- Run tests across full weeks, not partial days, to smooth out weekday and weekend traffic differences.
- Avoid judging a landing page conversion rate during holidays or unusual traffic spikes.
- Let a test run until both variations reach a meaningful sample size before picking a winner.
Patience here saves real money. Calling a test too early is one of the most common ways teams damage a landing page conversion rate they were actually on track to improve, and it explains why what is a landing page conversion this week can look very different from what it becomes once a full sample builds up.
Frequently Asked Questions
What is a landing page conversion, exactly? A landing page conversion is the moment a visitor completes the single action a page asks for, such as submitting a form or finishing a purchase. It excludes simple page views or clicks that never lead to that final step.
What is a good landing page conversion rate? A widely cited benchmark places 10% or higher as a strong result across most industries, based on 2026 Unbounce data. Your real target should still match your specific industry row in the benchmark table above, since a strong ecommerce rate looks very different from a strong legal services rate.
What is a landing page conversion rate formula? Divide total conversions by total visitors, then multiply by 100. A page with 200 conversions from 4,000 visitors converts at 5%, and tracking this weekly reveals trends a single snapshot cannot show.
What is a landing page conversion versus a simple click? A click only shows interest, while a landing page conversion shows completed action. Many clicks never turn into a finished form, purchase, or signup, which is why counting clicks alone overstates real campaign performance.
What is a landing page conversion rate benchmark by industry? Benchmarks vary sharply: ecommerce often sits near 1.3% to 3.5%, while legal and financial services often reach 8.4% to 16%. The full table above breaks down several major categories so you can find the closest match to your own business.
What is the fastest way to improve a landing page conversion rate? Matching your headline to your ad copy and cutting form fields usually deliver the quickest measurable lift. Both changes take little development time and directly reduce visitor friction, often producing results within a single testing cycle.
Final Thoughts and Next Steps
A landing page conversion turns advertising spend into real business results, and understanding this metric correctly changes how you judge every campaign going forward. Compare your numbers against your specific industry, not a generic average, and fix the small frictions before you rebuild anything from scratch.
Pull up your own analytics today and calculate your current landing page conversion rate using the formula above. Compare it against your industry row in the benchmark table, pick one improvement from the list, and test it this week. Small, consistent changes to a landing page conversion rate compound into major revenue gains over a single quarter, and the earlier you start tracking accurately, the sooner those gains show up in your reporting.